
Calvin Wong
Senior Software Engineer
How to debug deep linking for a terminated Flutter app on iOS
Save some time debugging your deep linked app!
Our team has been hard at work building our Flutter-based mobile app, Fora Communities. The app will eventually allow you to access more than 1,000 online enthusiast communities from a single application.
During development, we identified deep linking as an opportunity to improve our app's retention rate. Deep linking allows users to launch a mobile app when clicking on a link, and ensures that the user is directed to the correct place within the app. However, I found that debugging deep linking issues can be difficult in Flutter.
When implementing deep linking in the Fora Communities app, I noticed an issue. When the app was in a terminated state, clicking on a deep link to launch the app would not bring me to the correct page. After a bit of research, I found out there is an option to make the app not launch automatically when debugging. This allows us to manually launch the app via deep link from a terminated state after the app has been installed with the debugger attached. However, it took me longer than it should to figure out where the logs are being outputted, which is why I am writing this article to help others that may have run into the same problem.
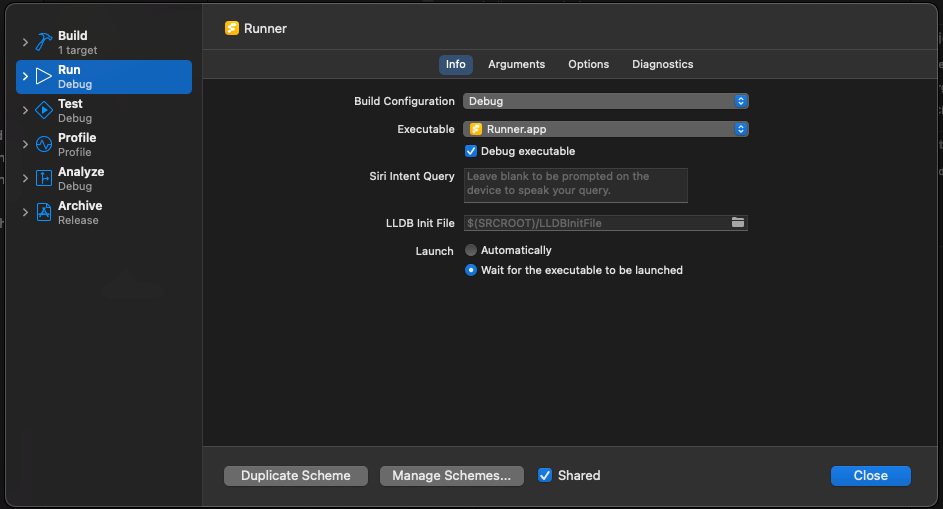
First, open your .xcworkspace file in Xcode. Then edit your project scheme by selecting Product → Scheme → Edit Scheme… in the top system menu tray, which will take you to the Run Debug section under the Info tab. Look for the Launch section. By default the launch option selected is Automatically, meaning when you build and run the app on a real device or simulator, it will automatically launch the app. For debugging purposes, select Wait for the executable to be launched instead.

Figure 1: Edit Scheme page and Launch options
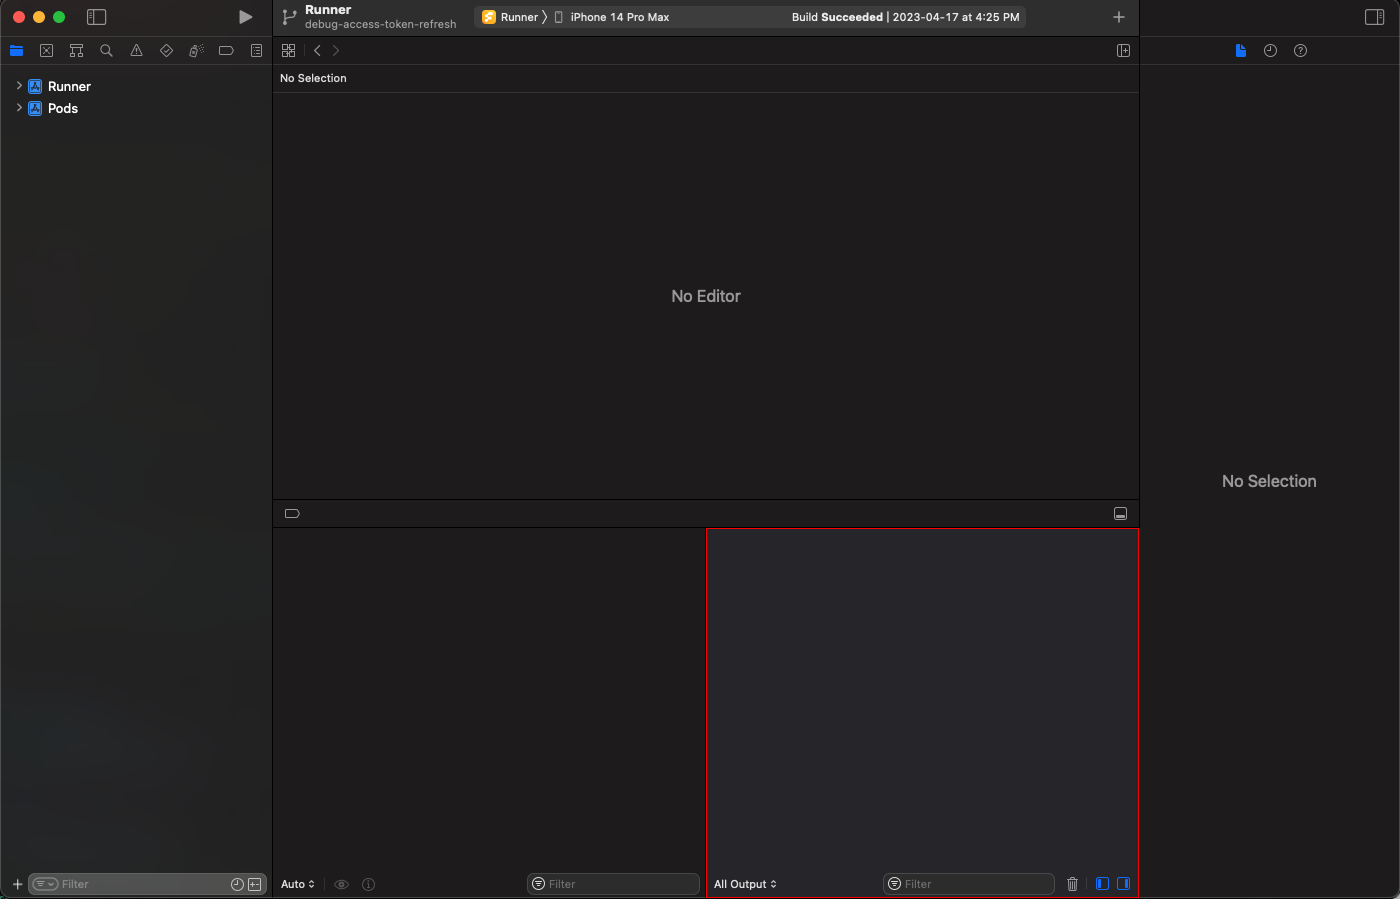
This means after you build and run the app, it will not automatically launch the app. Instead, it will wait until you manually launch the app before attaching the debugger to it. However, with this change, logs no longer appear in Xcode → Debug Area → Console.

Figure 2: The red highlighted area is where you normally see log outputs from the running app.
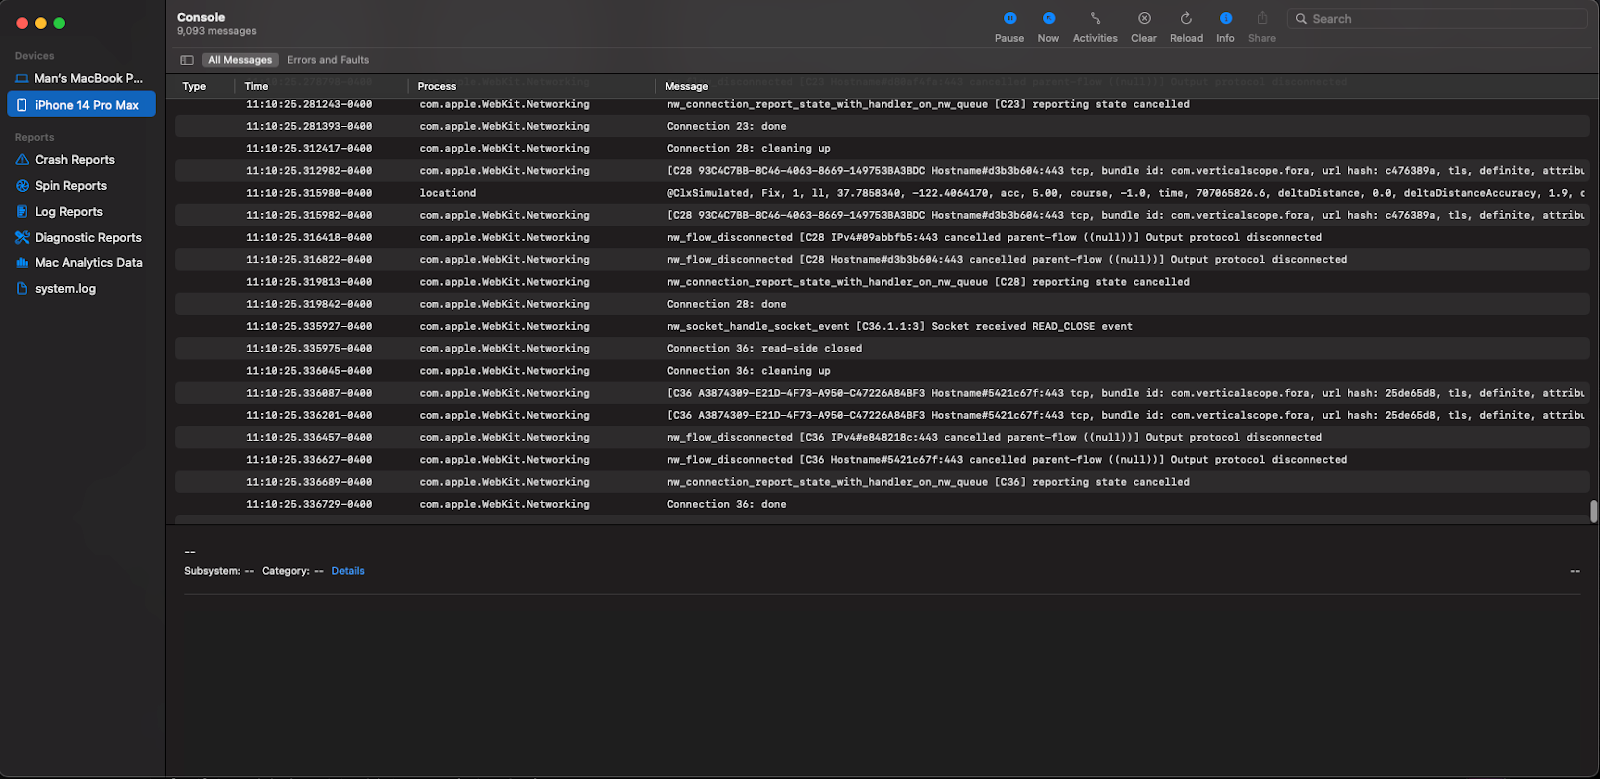
You will need to access the device logs to see your log statements. Open the Console.app Mac application. On the left side, under Devices, select your test device, then click Start in the top to the left of the search bar. Finally, open your app via deep link and, voila! – you should see debug logs within the Console.app for your app startup process via deep linking.

Figure 3: Logs of a running simulator within the Console app.
That's all there is to it. I hope this saves you time in debugging your terminated apps that are opened from deep links. Happy debugging!